Partial discharge (PD) diagnostics – measuring small regions of dielectric failure within high-voltage equipment including cables, transformers, switchgear, motors, and generators – can be extremely tricky to understand. One off value can mark an otherwise sound equipment as faulty, or go unnoticed for weeks before ultimately causing serious hardware failure. Despite more than 15,000 machines equipped with permanent PD sensors across the world and over 400,000 readings stored in the international database documented in the CIGRE 2016 study by Sedding, Stone and Warren, many plants find it difficult to produce consistent, reliable diagnostic assessments.
This guide unpacks the four hidden axes that make PD interpretation hard — sensor bias, asset baseline, noise contamination, and pattern ambiguity — and gives you a working framework to read PD results like an experienced HV test engineer.
Quick Specs
| What PD is | Localized insulation breakdown that does not bridge the full electrode gap |
| Typical voltage range | 3 kV to 700 kV and beyond |
| Governing standards | IEC 60270 (off-line, charge-based) · IEC 60034-27-2 (on-line, rotating machines) · IEEE 1434 (rotating-machine PD guide) |
| Primary measurement units | pC (picocoulombs, IEC 60270) or mV (on-line, wide-band) |
| Top 3 sources of interpretation error | Noise contamination · sensor-type bias · asset-baseline mismatch |
Why “Easy-to-Read” PD Reports Are Often Wrong

A PD report may appear reassuringly numeric — a Qm of 240 mV, an apparent charge of 12 pC, a pristine phase-resolved plot — but still lead you astray. What appears on the page is the result of at least four separate variables, any of which can mask or fake your reading: the sensor and its bandwidth, the asset class and its statistical norms, the noise environment around the test setup, and the discharge mechanism itself.
If the report neglects any of the above axes, the two failures are that either an alarm sounds on a “healthy” asset – a false positive that undermines the integrity of the testing regime – or a genuine fault ends up below an inappropriate threshold, so the asset fails in-between scheduled tests. As noted by field engineer “jburn” in a long-running Eng-tips exchange following his first commercial PD survey: “It does take a highly skilled engineer or technician to interpret the data as it is being taken.”
PD test interpretation is a four-axis decision: sensor / asset / noise / pattern. A confident-looking single number that neglects any of these four axes is more hazardous than having no number at all.
PD Fundamentals: What You Are Actually Measuring

A partial discharge is a flashover of a specific section of an insulation system which has an electric field gradient that is below the dielectric withstand level of the target section ( with the entire system still being able to sustain the applied electric field). Every flashover results in a high frequency pulse of current, as well as several observable consequences: light, heat, ozone, audible crackling, electromagnetic emissions, an HF earth-current pulse. Each of them can be detected with different types of sensors, as each reveals something slightly different about the defect.
Field practice divides PD into three families. Correct classification matters because each family produces a different PRPD signature, prefers a different sensor, and carries a different failure-rate profile.
| PD type | Where it happens | Best primary sensor | Pre-failure warning |
|---|---|---|---|
| Internal PD | Voids, cavities, gaps inside solid insulation; gas-filled defects within cast resin or polymer | TEV (switchgear); HFCT / 80 pF coupler (cables, transformers) | Often silent — no smell, sound, or visible sign before failure |
| Surface PD | Tracking across the surface of insulation, often at dry terminations or interfaces | Airborne ultrasonic; contact ultrasonic for sealed enclosures | Ozone smell, audible crackling, eventual surface erosion |
| Corona PD | Sharp electrode geometry discharging into a gas (typically air, occasionally SF6 anomalies) | UHF; airborne ultrasonic in open switchyards | Visible blue glow in dark; audible hissing in humid weather |
Before any meter ever gets installed on a substation, do a sensory walkdown. Ozone smell from a locked cabinet suggests surface PDs are active inside; loud crackling from switchgear gaskets suggests huge internal or surface activity; dead sometimes-visible corona at sharp edges on the outside is usually not an asset life issue but can initiate surface PD inside closed chambers if airflow is tight. Three minutes of sensory triage can tell you which sensor to put on first.
How Sensor Choice Biases Your Interpretation
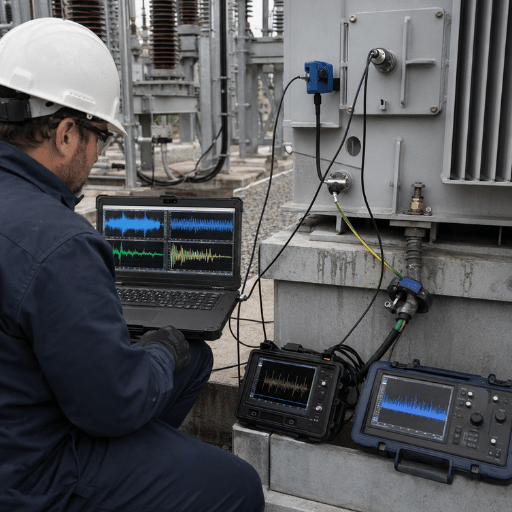
Two PD sensors on the same fault rarely give the same number. That is not measurement error, it is physics.
Each sensor type has its own bandwidth, coupling mechanism and frequency response, and each its own failure mode blind spots. Pick the wrong sensor and the report you generate is internally consistent but externally wrong.
| Sensor | Physical principle | Best-fit fault | Interpretation caveat |
|---|---|---|---|
| 80 pF capacitive coupler | Phase-terminal HV capacitor sensing pulse current | Stator winding (motors, generators); transformer terminals | Sensitivity drops for coils deep in the winding away from line terminals |
| Stator slot coupler (SSC) | Antenna under slot wedges, picks up local slot PD | Hydrogen-cooled turbogenerators where 80 pF couplers struggle | Local-only — does not see endwinding or terminal PD |
| TEV (Transient Earth Voltage) | HF EM pulses leaving switchgear through gasket openings | Internal PD inside metal-clad switchgear | Cannot localize to a specific cubicle without scanning multiple positions |
| HFCT / RFCT | Clip-on current transformer on cable earth lead | On-line MV/HV cable PD without taking the cable out of service | Picks up everything on the earth conductor — needs noise discrimination upstream |
| UHF | Antenna-based EM detection in the 300 MHz to 3 GHz band | GIS, open switchyards, cable systems where contact sensors are impractical | Sensitivity depends on antenna placement and shielding geometry |
| Ultrasonic (airborne / contact) | Acoustic emissions in the ultrasonic band, often dropping into audible range as severity grows | Surface PD and corona PD with an air path or contact path to the source | Misses sealed internal PD; sensitive to ambient acoustic noise |
Bandwidth merits its own note. Sensors operating above about 40 MHz pick up the first peak of a PD pulse as a traveling wave, prior to the inductance and capacitance of the winding distorting it. According to the Iris Power CIGRE study quoted above, that is why high frequency on-line measurements on stators behave as roughly absolute values -the meter does not see the full stator impedance loop.
Low bandwidth measurements, on the other hand, see a heavily filtered pulse, and the absolute value depends strongly on coil geometry. Cross machine comparison in a single sensor bandwidth domain only makes sense.
When you need one field instrument that covers the full sensor family, and all that family shares trending software, look at integrated professional high voltage test equipment rather than single-sensor units that leave you trapped into one interpretation model.
Asset-Type Acceptance Baselines and Why Cross-Asset Comparison Fails

A Qm of 250 mV on a 13.8 kV air-cooled turbogenerator is innocuous; the same number on a hydrogen-cooled machine at 30 psig is a strong fault investigation trigger; on an oil-filled transformer it is meaningless because the instrument was probably operating in the wrong scale. PD thresholds are asset-class-specific, and you should read any rule you import from another asset class as an authoritative “rule of thumb” that will mislead you.
Reference baselines by asset class
| Asset class | Typical method | Units | Investigation trigger | Standard |
|---|---|---|---|---|
| 13.8 kV air-cooled stator (TGA) | On-line, 80 pF coupler | mV (wide-band) | Qm above 90th percentile (about 529 mV per Iris dataset) | IEC 60034-27-2 · IEEE 1434 |
| Hydrogen-cooled stator (>30 psig) | On-line, 80 pF coupler or SSC | mV (wide-band) | 90th percentile typically near 250 mV — about half the air-cooled threshold | IEC 60034-27-2 · IEEE 1434 |
| MV oil-filled transformer | Off-line factory test; HFCT on-line in service | pC (off-line); mV (HFCT on-line) | Acceptance values defined by purchase spec; consensus rejection above 100 pC at 1.5 U0 | IEC 60270 · IEC 60076-3 |
| XLPE MV cable | Off-line VLF or damped-AC at 1.5 to 2.0 U0; on-line HFCT | pC (off-line, IEC 60270 charge-calibrated) | Any detectable PD at electrical-tree signature is significant — typical remaining life: hours to days | IEC 60270 · IEEE 400.4 |
| MV metal-clad switchgear | On-line TEV plus ultrasonic survey | dB (TEV); dB (ultrasonic) | TEV consistently above 20 dB or rising; any audible ultrasonic activity | IEC TS 62478 |
Hydrogen-cooled machines consistently demonstrate lower PD magnitudes than air-cooled machines of equivalent kV rating, because the higher dielectric strength of pressurized hydrogen raises the inception voltage of bulk insulation flaws. Per the Iris on-line PD database, the 90th-percentile Qm at higher H2 pressures drops to roughly half the air-cooled value. Comparing any hydrogen-cooled reading against an air-cooled threshold table is a mistake because gas-gap geometry dominates the result.
One helpful field observation: when “kraigb” of a North American utility scheduled their MV underground distribution at 1.5 to 2.0 per-unit voltage, the ratio of PD “hits” in cable accessories – splices, terminations, elbows – versus the cable itself was far higher than the 4:1 accessory-to-cable failure ratio in service. Insulation degradation from workmanship errors at the accessory connection point, rather than bulk cable insulation failure, was the source of most of the PD activity they observed. Baselines drawn from cable manufacturer specifications seldom account for that — adjust your expectations if the survey is accessory-heavy.
PRPD Patterns: Reading the Phase-Resolved Plot
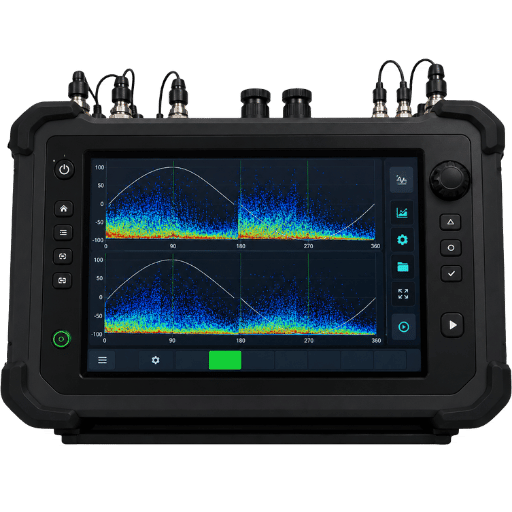
Phase resolved partial discharge (PRPD) plotting is by far the most useful aid to interpretation, as well as the easiest to abuse. Every individual pulse is plotted a 2D plot of the AC phase angle (x-axis, 0 – 360 degrees) and the pulse amplitude (y-axis). Watch the same defect long enough and a identifiable cloud is created – the shape of the cloud identifies the class of defect firing.
The 4-Pattern PRPD Checklist for Field Triage
- ✔
Internal void (bulk insulation): Roughly equal cloud density on both positive and negative half-cycles, centered around 45 and 225 degrees. Magnitudes cluster tightly. Pulse polarity symmetry is the giveaway. - ✔
Surface PD (delamination or interface tracking): Asymmetric pattern — more activity on one polarity than the other. Cloud spreads broadly along the rising voltage edge. Often paired with audible crackling and ozone smell. - ✔
Corona PD (sharp electrode in gas): Tight, repeatable pulse population at one phase angle, almost always positive half-cycle. Magnitudes are uniform and low. Often suppressed by humidity changes. - ✔
Floating-metal or poor contact: Sparse, very-high-magnitude pulses at low repetition rate, often at non-canonical phase angles. The signature looks chaotic compared to the other three — that chaos is the diagnosis.
Polarity indicates the void location. As one experienced motor-industry engineer (“electricpete”) summarized in a long-running Eng-Tips practitioner thread on PD interpretation: positive pulses dominating implies voids on the outer wall of the insulation (between the insulation and the ground plane), negative pulses dominating implies voids on the inner wall (between the insulation and the energized conductor), and roughly equal positive plus negative populations implies voids in the insulation bulk. That single polarity check, taken before any magnitude analysis, often resolves whether a borderline reading deserves an outage or another six months of monitoring.
“We have tested in excess of 10,000km of MV cable globally, and I can count the voids we have encountered on one hand. Academics love a good theory about them as much as they do their beautiful mathematics, but in reality they are an issue of exceedingly low probability. In virtually all the aged cable PD studies I have been involved with, an electrical tree was found close to a water tree.”
— senior cable PD test engineer, Eng-Tips practitioner forum
This field reality contradicts the boilerplate statement about Cable PD, and should cause caution when interpreting a cable plot. If your pattern shows the broad, asymmetric cloud of moisture-driven tree development rather than the narrow internal-void signature, you are almost certainly looking at a water-tree-to-electrical-tree progression rather than a manufacturing void — and the remaining service life is measured in days, not years.
Noise Discrimination: The Number-One Source of False Alarms
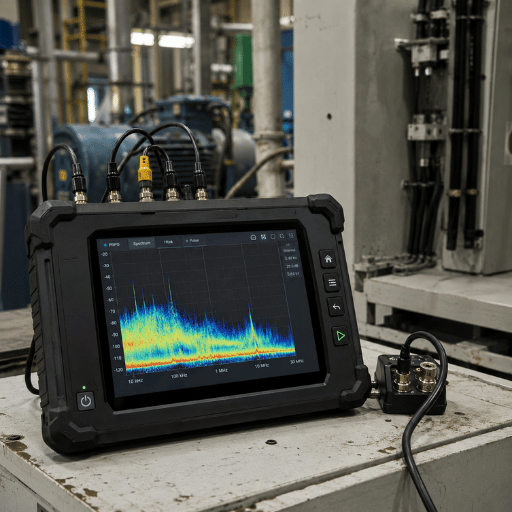
Interference is the largest single factor of false PD interpretation. The same OMICRON white-paper on noise suppression describes the 3PARD principle thusly: “External disturbance often dominates the PD signal, so the apparent charge value indicated by the measurement system in accordance with IEC 60270 is increased compared with the real apparent charge value from the test object.” If the noise level exceeds that of the signal, the test measures the noise, not the PD.
This can be very costly plants, through over-buying on false alarms. As an electrical engineer described by a 13.8 kV 30-machine group of similar installation: “Approximately 50% of the machines report a level higher than the predetermind warning point set by the vendor.” When this makes half your false alarms, operational personnel ignore the reports – allowing the one real alarm next month to go unnoticed.
Noise sources you will encounter
| Noise source | Typical PRPD signature | Best discriminator |
|---|---|---|
| Power-system corona | Pulses concentrated at peak voltage; suppressed by humidity rise | Phase-window gating; 3PARD geometry filter |
| Slip-ring or commutator sparking | Random across cycle; modulated by rotor speed | Cross-correlate with shaft speed; time-of-flight separation |
| Inverter / VFD switching | Periodic 6-pulse cluster at fixed phase positions | Channel gating from a coupling near the inverter |
| Mobile radio / cell-tower RF | Burst noise unrelated to AC cycle; specific frequency band | 3FREQ / 3CFRD frequency-signature filtering |
| Electrostatic precipitator | High-amplitude impulses, irregular firing | Window gating in phase and amplitude |
Two analytical techniques published by OMICRON have become de facto field standards for noise-vs-PD separation. 3PARD — the 3-Phase Amplitude Relation Diagram — uses synchronous three-phase measurement and projects all pulses onto a single star diagram so that genuine internal PD (which is phase-correlated) separates visibly from noise (which is not). 3FREQ, also called 3CFRD, applies three digital filters at different centre frequencies to a single channel and characterises each pulse by its frequency signature, so corona, inverter noise, and true PD form distinct clusters even when only one phase is instrumented. Both methods turn noise-vs-PD discrimination from a heuristic exercise into a graphical decision.
Prior to any PD survey, construct a reference trace with the test article de-energized, sensors installed, quite. That becomes the noise reference – anything present with power off will be noise; anything only appearing in the energized trace is a PD candidate.
Which Standard Applies? IEC 60270 vs IEC 60034-27-2 vs IEEE 1434
Three documents dominate most PD acceptance decisions, and they scarcely overlap as titles and maturities suggest. Use the wrong one and you find yourself applying the wrong off-line acceptance criteria on on-line data, or relating rotating machine results to an apparatus standard that was never intended for stator windings.
| Standard | Scope | On/Off-line | Units | Acceptance approach |
|---|---|---|---|---|
| IEC 60270 (latest edition 2025) | Charge-based PD measurement on HV apparatus generally | Primarily off-line / factory | pC, charge-calibrated against a reference impulse | Test-specification driven; the product standard sets pass/fail |
| IEC 60034-27-2 | On-line PD on the stator winding insulation of rotating electrical machines | On-line, in normal operation | mV (wide-band) or pC (where calibration is feasible) | Trend-based; comparative against similar machines and prior measurements |
| IEEE 1434 (2014) | Guide for the measurement of PD in AC electric machinery | On-line and off-line guidance | mV most commonly | Statistical, requires stable operating conditions for valid trending |
Reporting on-line stator PD in pC implies an IEC 60270 charge calibration that is generally not achievable on a complete winding, because the inductive and capacitive load of the stator distorts the calibration pulse. Per the CIGRE 2016 Iris Power study, on-line stator pulse magnitudes are measured in mV “rather than picoCoulombs, due to the difficulty in calibrating into pC.” If a report mixes the two units on the same machine, treat the numbers with caution.
A Decision Framework for a Single PD Reading
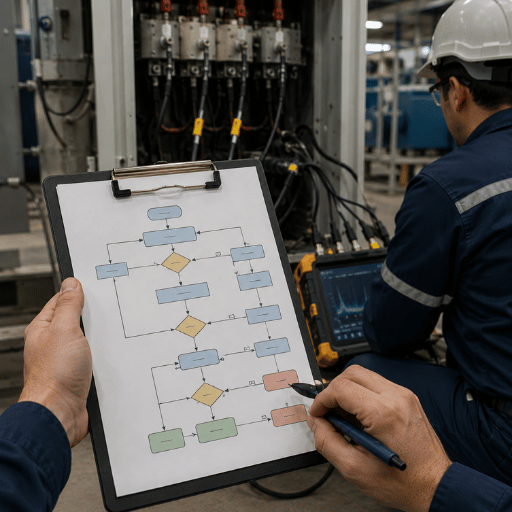
Most field technicians can only react to a single reading at a time, and usually without the advantage of months of trend. The “4-Step Single-Reading Triage” below is derived from Iris Power statistical research plus the accumulated practitioner consensus on Eng-Tips and similar forums over twenty years. It is no substitute for trend; but it is a defendable action when a trend is not available.
- Normalize to asset-class. Transform the raw reading into a percentile against an asset-class dataset of the same voltage, cooling method, and sensor type. The Iris dataset establishes that readings above the 90th percentile have historically correlated with confirmed insulation deterioration in more than 200 visually inspected cases.
- Discriminate noise. Replay the measurement with channel gating, 3PARD, or 3FREQ active. If the value falls by more than 6 dB after filtering, the original was at least half noise. Re-trigger the threshold check against the filtered value.
- Classify the pattern. Match the dominant PRPD signature against the 4-Pattern Checklist above. Internal-void and surface PD signatures justify investigation; corona alone usually does not. Floating-metal patterns demand an outage — they progress quickly.
- Action selection. If steps 1 to 3 all clear (under 90th percentile, no filtered-noise drop, corona-only pattern), continue normal monitoring. If any one fires red, schedule the corresponding follow-up: comparative off-line PD test at 1.5 to 2.0 per-unit voltage for cables and bushings, visual inspection at the next outage for stators, accelerated re-test within 30 days for any borderline switchgear.
A note on operating-voltage limits: as one Eng-Tips contributor with a 10,000 km cable test history noted, “3% or less PD sites will show up at operation voltage” — most cable insulation defects do not discharge at nominal voltage, so on-line testing alone systematically misses them. When the cost of a missed flaw is outage, plan to follow up an on-line survey with an off-line measurement at 1.5 to 2.0 per-unit voltage. Properly equipped Demiks Power high voltage test equipment provides both on-line and off-line capability in one instrument family, which makes the data directly comparable.
2025 to 2026 Outlook: AI-Assisted PD Pattern Interpretation
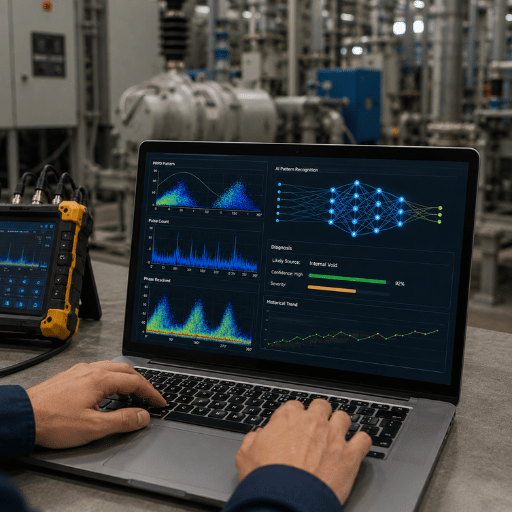
In the past two decades, the biggest change in PD interpretation has been the adoption of image-based deep learning for pattern recognition. A 2025 paper in MDPI Applied Sciences launched TEV-based AI-augmented monitoring using convolutional networks directly consuming the PRPD plot as an image, rather than a vector of extracted features. Similarly, a 2025 indexed at PubMed Central applied CNN and recurrent network architectures to PD signal classification in power transformers, with classification accuracy outperforming traditional support vector machine baselines.
For the asset-owner, two hard facts in 2026 matter. First, the new EN IEC 60270:2025 edition has refreshed the specifications for charge-based PD measurement after a 25-year hiatus – if you specify factory acceptance tests for HV equipment in 2026 or later, reference the 2025 edition rather than the 2000 edition. Second, AI interpretation is already a useful second opinion rather than a blind substitute for an experienced analyst; treat it as a triage tool that marks candidates for human review, not as a black-box pass/fail.
Frequently Asked Questions
Q: What is the most common cause of partial discharge in transformers?
View Answer
Q: What is the acceptable level of partial discharge in MV cables?
View Answer
Q: How does on-line PD testing differ from off-line PD testing?
View Answer
Q: What does IEC 60270 actually specify?
View Answer
Q: Can AI accurately interpret PRPD patterns?
View Answer
About This Analysis
This guide summarizes peer-reviewed CIGRE studies on live PD interpretation for rotating machines, technical whitepapers from OMICRON on noise suppression and PRPD analysis, the IEC 60270, IEC 60034-27-2 and IEEE 1434 standards related to PD measurement, and specialist discussion on the Eng-Tips electrical-engineering forum. It is a working interpretation guide for the benefit of engineers that specify, operate or commission PD testing with high voltage testing instruments. Reviewed by the Demiks Power engineering team.
References & Sources
- Progress in Interpreting On-Line Partial Discharge Test Results from Motor and Generator Stator Windings (Sedding, Stone, Warren) — CIGRE 2016, Paris
- How to Analyze Partial Discharge — OMICRON electronics GmbH technical whitepaper
- Noise Suppression and Source Separation Techniques (3PARD / 3FREQ) — OMICRON electronics GmbH
- IEC 60270:2025 — High-voltage test techniques — Charge-based partial discharge measurements — International Electrotechnical Commission
- IEC 60034-27-2 — Rotating electrical machines — On-line partial discharge measurements on the stator winding insulation — International Electrotechnical Commission
- IEEE 1434-2014 — Guide for the Measurement of Partial Discharges in AC Electric Machinery — Institute of Electrical and Electronics Engineers
- AI-Augmented Partial Discharge Analytics for TEV-Based Monitoring — MDPI Applied Sciences, 2025
- Research on partial discharge signal recognition and classification using deep learning — PubMed Central PMC12633952, 2025