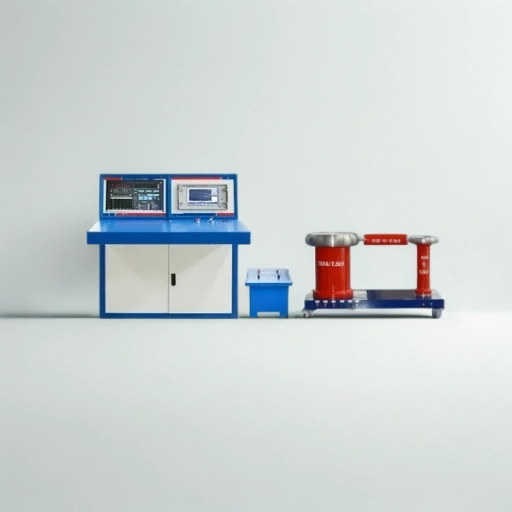
The phrase “PD testing equipment not field ready” gets Googled by engineers who, just after commissioning, have found by trial that a device which performed flawlessly in a vendor demo or factory acceptance test is now producing unreadable data in a hot, live substation. The issues seldom originate in a single fault but rather a series of imperfections and inaccuracies in expectation, design, and installation; a sequence from lab test to field work that needs elucidating. This document takes it a step further, identifying what “field ready” means with respect to partial discharge equipment, the five most frequent failure modes in the field that catch teams unaware, and the decision trees engineers use when selecting sensors, treating noise, and conducting a conclusive field PD survey from mobilization to report.
Quick Specs — Field PD Testing at a Glance
| Governing standards | IEC 60270:2025 (charge-based) · IEC 62478 (UHF/acoustic) · IEEE 400.3 (cables) · IEEE C57.113 (transformers) |
| Common sensor frequency ranges | HFCT 10 kHz–100 MHz · TEV 5–80 MHz · UHF 300 MHz–2 GHz · Acoustic 20–300 kHz |
| Typical apparent-charge sensitivity | 1–5 pC in shielded labs · 50–500 pC in noisy substations |
| Field test modes | Online (energised, periodic spot or continuous) · Offline (de-energised, VLF/AC source) |
| Asset coverage | Transformers · MV/HV cables · Switchgear (AIS & GIS) · Rotating machines · Bushings |
1. What “Field-Ready” Actually Means for PD Testing Equipment
Vendors will proudly proclaim “field-ready” test gear but buyers need to define a tighter standard before field failure becomes “equipment not field-ready.” A “field-ready” partial discharge test instrument is equipment that performs to specified sensitivity, calibration, and S:N performance criteria through the gauntlet of switchyard environments, medium-voltage sensor cabling and connections, battery-powered operation, and manually strained cords and handles that characterize a full-blown field job – not just a cold room or GPS-synched voltage simulator calibration set. For a refresher on what a partial discharge actually is, the short version: a localised dielectric breakdown inside insulation that erodes it long before a fault is visible to standard insulation-resistance tests.
Practically, just five performance specifications separate field-ready partial discharge dataloggers from lab-only instruments: (1) noise rejection at point of sensor and at data acquisition system – not during post-collection processing; (2) calibration temperature stability – healthy substation swings from 0–50 °C in one hot summer day; (3) ingress protection at connector, sensor head, and cable – IP65 is the minimum outdoor switchyard requirement; (4) durability and repeated use of sensor interface technology without loss of sensitivity; and (5) usability of operator controls, device hardware, and information display in direct sunlight and gloves-on.
Failure to specify or test equipment to all of these standards stops the vendor from having another “almost field-ready” message in their toolkit; it is a promise that can never be fulfilled, yet one that is so often believed, that from a reliability perspective it might as well be.
2. The 5 Field Failure Modes of PD Testing Equipment
Across published case work and field-engineer accounts, the same five failure modes seem responsible for the bulk of “not field-ready” designations. None of these conditions are perplexing — what makes them dangerous is that lab acceptance protocols rarely simulate them. What follows — call it the five-failure-mode lens — is synthesised from IEEE Alberta’s introduction to partial discharge, the CIGRE WG D1.37 technical brochure, and engineering interviews collected by Megger and Omicron.
Mode 1 — Noise saturation at the sensor head
Symptom: the noise floor is within 10dB of the anticipated PD signal or otherwise wraps individually-derived phase-resolved images in enervating static. Cause: broadband emissions from VFD harmonics, switching powersupplies, “floated” insulation grounds leaking into sensors. Resolution: switch to a UHF or narrowband sensor, physically reposition a ground conductor and employ a completely shielded coupling capacitor. A purpose-built PD detector with selectable bandpass usually clears this within one site visit.
Mode 2 — Calibration drift between lab and field
Symptom: pC readings for the same defect differ by 30-60% between morning and afternoon, or between a 22 °C control room and a 45 °C outdoor cabinet. Cause: the pulse calibrator used in the lab was not re-applied on site, or the sensor’s coupling impedance changed with temperature. Fix: re-calibrate at the asset, in ambient temperature, before every measurement campaign – not once per quarter as some quality systems still call for.
Mode 3 — Self-extinguishing PD activity
Here is another dry-shrimp for seasoned teams. As Megger’s expert interview notes, PD activity tends to self-extinguish on steady-state operation, then flares up again under load changes or thermal cycling. Symptom: a one-time field measurement shows “no PD” when a defect is actively developing. Fix: never measure an asset in the field only once per visit; gather measurements at 2 or more loading conditions across 2 or more ambient temperatures and trend across multiple visits.
Mode 4 — Connector and cable degradation
Symptom: sensitivity drops 20-40% after 50-100 connector mate cycles, with no physical evidence of damage. Cause: BNC or N-type connectors degrade quickly under field handling, and the resulting impedance mismatch attenuates the highest PD frequency components first. Fix: replace connectors once per year pro actively, and check the inner conductor on every coupling capacitor before each survey. This is a US$50 fix that prevents a US$50,000 misdiagnosis.
Mode 5 — Operator interpretation gap
The least-covered failure mode. Field crews often confuse corona, bad earth arcing, or radio noise for real internal PD – an errors of interpretation that practitioner guides point out as the leading diagnostic mistake. Hardware did its job; workflow did not. Fix: pair every junior crewman with a veteran reviewer for the first 20 surveys, and require phase-resolved pattern (PRPD) images in every report so a remote second-opinion can check your work.
3. Online vs. Offline Field PD Testing: A Decision Matrix
Online PD testing tracks activity when the asset is energized at normal operating voltage; offline requires de-energization and an external voltage source (or resonant set). Both have their place in a field program. A common misconception is treating them as competing solutions rather than as a logical pair: online detects major issues under actual stress; offline corroborates suspect online results under controlled stress.
| Decision criterion | Online wins when… | Offline wins when… |
|---|---|---|
| Outage tolerance | Asset cannot be taken out of service (24×7 production, hospitals, data centres) | Scheduled maintenance window already exists or asset is being commissioned |
| Sensitivity needed | Defect detection at gross levels (≥100 pC) is sufficient for decision-making | Acceptance test requires sensitivity below 10 pC at controlled voltage |
| Defect localisation | Asset-level identification (“which transformer?”) is enough | Sub-component localisation needed (which winding, which joint?) |
| Standards compliance | Condition monitoring per IEC 62478 framework | Acceptance per IEC 60270 charge-based methodology |
| Operating cost | Lower per-survey cost; no production loss | Higher per-survey cost (outage + voltage source) but cleaner data |
This decision is never all-or-nothing. A common layered approach applies an online snap survey to every substation, pinpoints the 5-10% of assets with high activity levels, then plans offline validation only on those. This minimizes outage duration on assets where the online data casts real doubt.
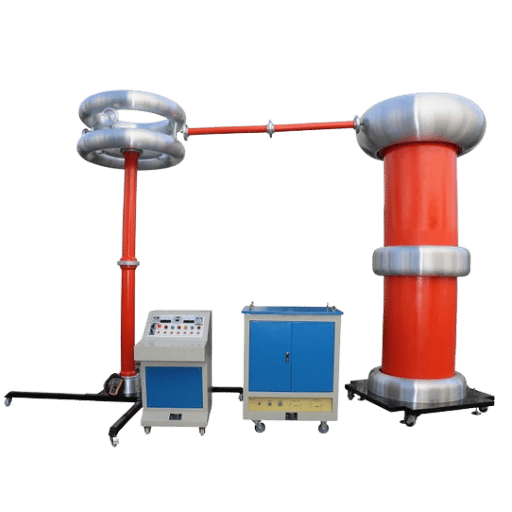
4. What IEC 60270 Requires for Field Measurements (and Where It Falls Short)
IEC 60270:2025 – the most recent edition replacing the long-standing 2000 edition – is the essential standard for charge-based PD measurement. It defines apparent charge in picocoulombs, calls for pulse calibration before every measurement, and sets acceptance limits for high-voltage test techniques. It is the best reference for factory acceptance testing inside a shielded room. For field testing, it has clear limitations.
What sensitivity is required by IEC 60270?
Far and away the most common definition of field quality: no definition at all! It’s not hard to specify values, but the method of measurement must be agreed to in advance, so as to allow repeatability and comparison. IEC 60270 sets the standard: the requirement is for calibration to be and be able to be repeated and traced. Typical lab measurements per IEC 60270 will show a 1-5 p C sensitivity, while the same instrument on site will range from 50-500 p C , limited only by the noise floor; IEC 60270’s idealized signal-acquisition assumptions (perfectly low ambient noise, light contained bandwidth, etc.) do not apply in a substation environment. This is not a standard fault with the IEC 60270, it merely demonstrates the limitations of charge-based testing when outside a time- and noise-controlled environment.
For the unconventional methods the field actually depends on — UHF and acoustic emission — the corresponding standard is IEC 62478. CIGRE WG D1.37s technical brochure addresses the boundary conditions between the two standards in detail, and makes clear the types of conditions under which either measurements will be most successful. IEEE 400.3, the industry standard for field cable-specific testing, simply states in the IEEE Alberta reference that it “does not conflict with or support IEC 60270”– one of the clearest statements that cable-field testing is a different Standard than lab charge-based.
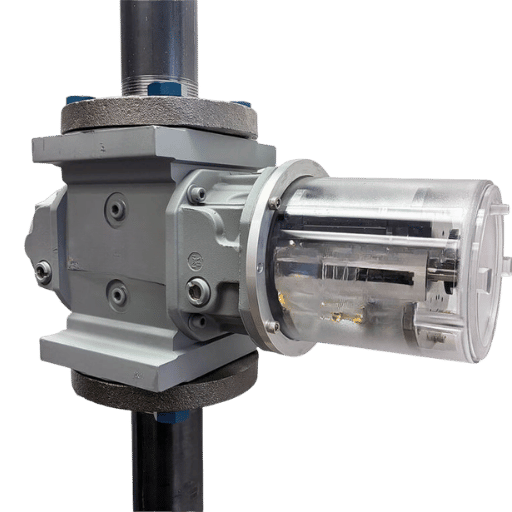
5. Sensor Selection for Field Conditions: HFCT, TEV, UHF, or Acoustic
There is no one type of sensor that will meet every need for a complete field program: the range of PD severity, asset type and location, and asset geometry encountered are too vast. Settling for the wrong one is a leading cause of failed customer expectations (after noise saturation). A single field kit should have at least three of the four mainstream sensor families, each with its own advantages, and a clear delineation of choice.
What frequency range does each PD sensor cover?
| Sensor | Frequency range | Best asset coupling | Field noise immunity | Field difficulty |
|---|---|---|---|---|
| HFCT | 10 kHz–100 MHz | Cable shields, transformer earth straps, GIS spacers | Low–medium (broadband makes it noise-prone) | Easy install, sensitive to placement |
| TEV | 5–80 MHz | Switchgear panel covers (capacitive coupling) | Medium (subject to corona pickup) | Very easy — magnet-mounted |
| UHF | 300 MHz–2 GHz (research extending to 4.5 GHz) | GIS, dry-type transformers, shielded enclosures | High — narrowband selection rejects most ambient | Requires viewing window or built-in antenna port |
| Acoustic (AE) | 20–300 kHz | Transformer tank walls, oil-filled bushings | Medium — mechanical noise interferes | Requires triangulation for localisation |
Research from KTH Royal Institute of Technology on cable terminations shows HFCT is the most sensitive sensor for all PD types, at all levels, while a comparison of UHF and HFCT in live detection shows the latter outperforms the former in real-world noise rejection in the 600-800 MHz band. Practical application: in a low-noise environment use HFCT for maximum detection sensitivity. In a high-noise environment, choose UHF for enhanced noise rejection.
“For a busy switchyard survey, the decision to use UHF or HFCT is rarely a matter of which sensor is ‘better.’ The decision is whether noise or low-amplitude internal PD in your environment is the dominant challenge. Keep both sensors and a clear protocol for switching between them, and you will collect far cleaner data.”
— Synthesised from CIGRE WG D1.37 method comparison and IEEE Alberta field PD guidance
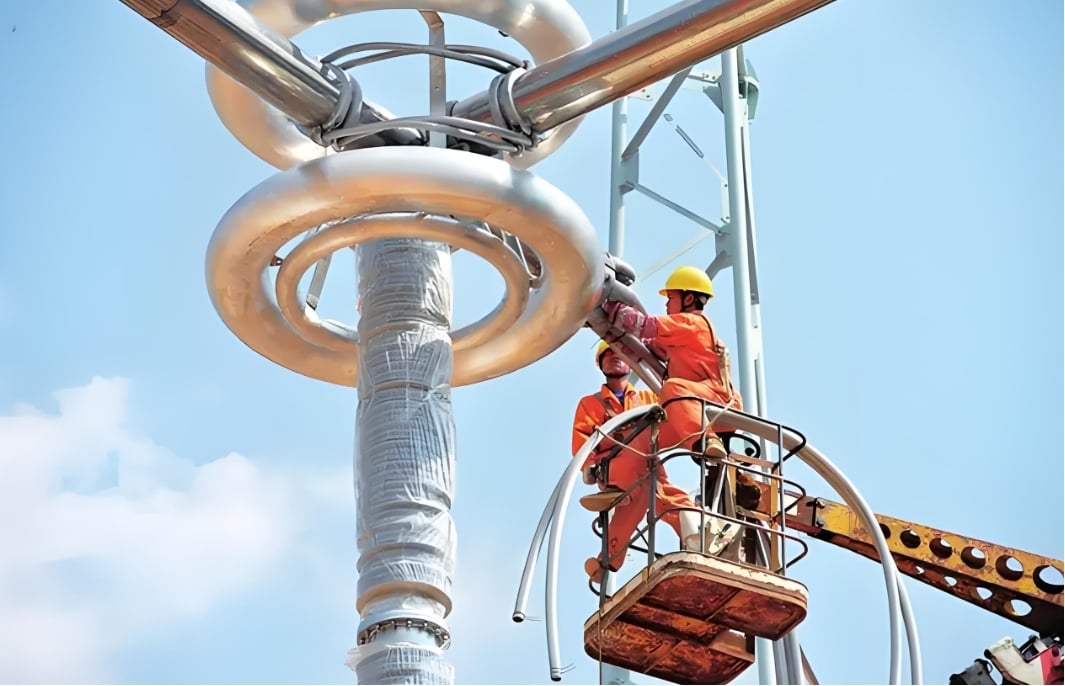
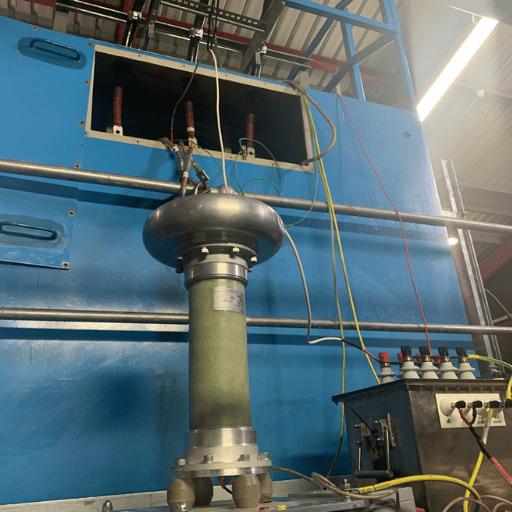
6. Field PD Testing on Transformers
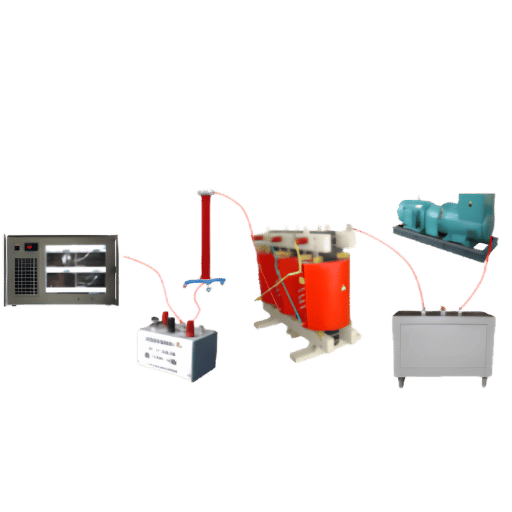
Transformer mobile field PD testing is a dual-sensor approach, utilizing electrical measurements through bushing tap leakage-current sensors and acoustic measurements for the tank itself, as neither sensor alone can definitively determine whether discharge is internal or external. The IEEE Field Guide for Partial Discharge Measurement on Liquid-Filled Power Transformers strongly recommends bushing tap coupling as the electrical measurement input for online testing, citing IEEE C57.113 as the standard reference.
For commissioning and acceptance, PDIV (partial discharge inception voltage) and PDEV (extinction voltage) are recorded across applied voltage steps. The interval between PDIV and the rated operating voltage defines the design margin; the interval between PDIV and PDEV reveals how easily the discharge might be reignited after interruption—a subtle diagnostic that many teams neglect when reporting PDIV and dismiss as unimportant. Some readers will be familiar with this information, while others will have seen teams with good PDIV but unquestioned lack of PDEV, losing half the diagnostic information. Modern transformer test equipment records both automatically when voltage ramp-up is configured correctly.
The situation is different with dry-type units. Without oil acting as a lossy medium that suppresses activity until it manifests visually, surface tracking and inter-turn discharge are more apparent early on; and UHF antennas placed near ventilation grilles may pick up activity that bushing-tap HFCTs won’t. While the audible feedback is louder, the trade is generally one of working in a noisier environment—the extremely successful application of dry-type units is often in manufacturing or other high-electrical-noise contexts.
7. Field PD Testing on Cables (MV/HV)
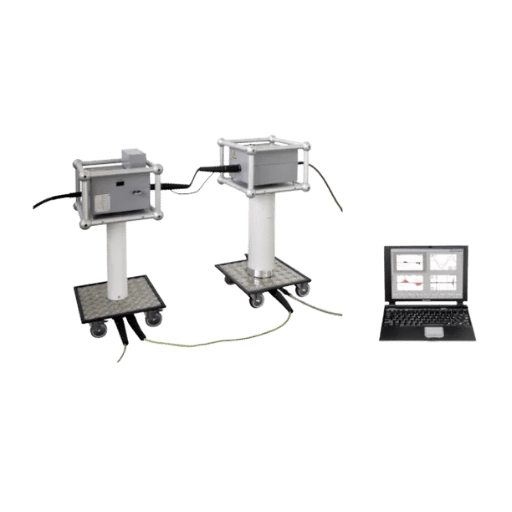
Cable PD measurement in the field differs significantly from transformer procedure. Cables are distributed assets—the long transmission means a single point measurement at one termination might miss activity elsewhere; the signal’s high frequency content is affected by attenuation along the cable; and potential failure points lie in accessories—connectors, terminations, joints—rather than the bulk insulation. IEEE 400.3 is both the authoritative field guide and, as pointed out by the IEEE Alberta work cited above, intentionally operates outside IEC 60270 charge-based technology.
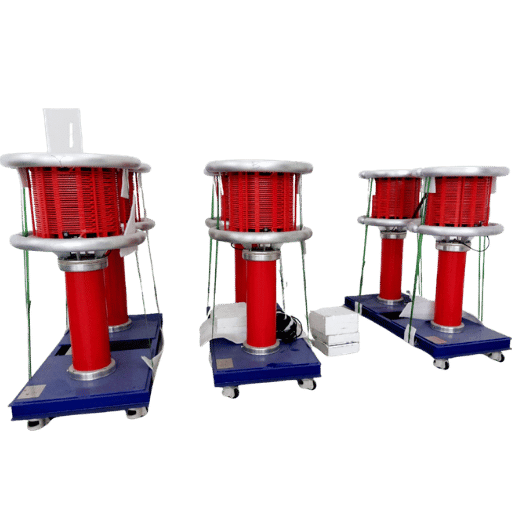
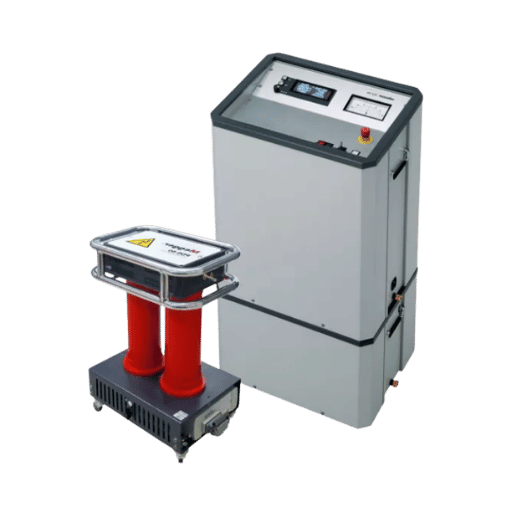
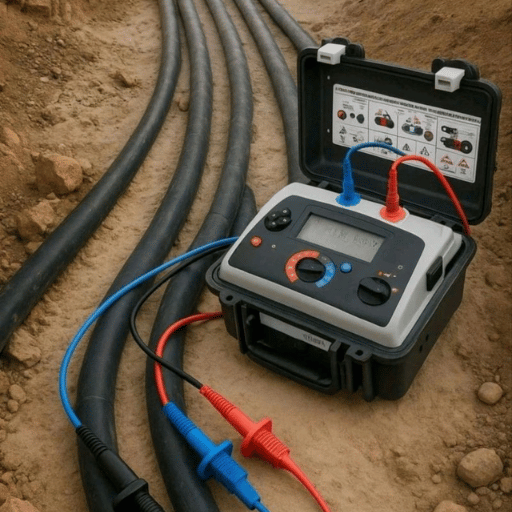
Two test schemes predominate. Offline + VLF + PD applies a very-low-frequency source of 0.1 Hz to energize the cable while a coupling capacitor and PD detector monitor activity at the B- or B+C-end; the low frequency minimizes source size—thus leading to manageable gear—and is non-destructive to the cable. Online + HFCT employs a high-frequency current transformer clamped around the cable shield earth strap and detects PD activity while the cable remains energized during normal operation; it is quicker and easier, but blind to defects that only ignite at elevated operating voltage.
For the commissioning of new MV/HV cable installations, a process—offline VLF+PD acceptance test followed by an online baseline measurement after energization—L provides both the regulatory acceptance and a baseline signature for future condition assessment. A VLF generator sized to the cable’s capacitance is the critical piece of gear; an undersized source won’t be able to energize long cable runs to the test voltage. Pair it with a cable fault locating system when pinpointing a confirmed PD source is a requirement.
8. Field Calibration & Noise Management
Most “not field-ready” assessments are ultimately blamed on either calibration or noise discipline, rather than the gear. A defensible field measurement follows a four-step routine prior to the extraction of the first PD metric.
What is an acceptable noise floor for field PD testing?
As a general guideline, the ambient noise floor should sit at minimum three times below the weakest PD value sought by the survey. In a substation targeting a sensitivity of 100 p C, that means noise below around 30 p C equivalent—something most field environments won’t manage without noise suppression—while in GIS systems, UHF measurements bypass the apparent-charge unit entirely and show the PD source in dBm or μV, where a minimum 10 dB separation between PD signal and noise should be the rule.
- Commissioning the asset – inject a specified-charge pulse (generally 100 pC) at the coupling point, record and save the results of the system response for that session’s calibration factor.
- Map the noise floor – acquire 60 seconds of background data with the asset de-energized or at a known-quiet operating condition. Record the frequencies and magnitude levels of the background noise.
- Configure sample gates – apply time-domain or frequency-domain gates designed to abolish the noise sources measured in step 2. Ensure the gates do not eliminate the PD frequency band of interest.
- Determine optimal bandpass – a narrow bandpass is more effective at noise rejection per Hz, a broadband bandwidth gathers more PD energy. Make this selection based on the dominant time-domain and frequency-domain noise pattern. Use narrowband filters on line harmonic content, broadband filters on impulsive noise.
Applying this procedure at the start of every survey day not once per quarter is the most significant process discipline advance a team can make in moving from laboratory to field for PD testing.
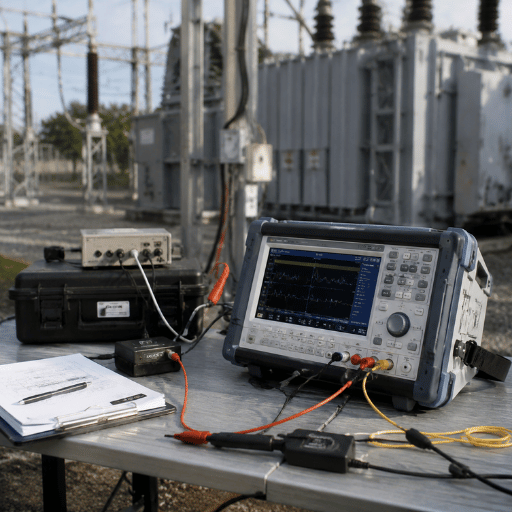
9. Field PD Test Workflow: 7-Step Checklist
The procedure presented below is an integrated workflow adapted from the IEEE Field Guide for transformer PD testing and CIGRE D1.37 findings for method comparison. It emphasizes process and decision-step rather than direct measurement correlations. It translates between asset classes, not PD signatures.
- ✔
Step 1 — Survey planning: list assets in priority order (criticality × age × known history). Estimate 30–60 minutes per asset for a spot survey, longer for first-time assets requiring sensor placement experimentation. - ✔
Step 2 — Safety setup: confirm electrical permits, grounding, PPE, and that the asset’s protection scheme will not trip on the test current path. For online surveys, verify that the chosen sensor coupling does not require breaking any safety bond. - ✔
Step 3 — Calibration at asset: run the pre-test sequence in section 8. Save the calibration record with timestamp and ambient temperature. - ✔
Step 4 — Noise survey: 60 seconds of background data, document dominant noise sources and frequencies. Adjust gating before measurement. - ✔
Step 5 — Sensor placement and measurement: capture at least one phase-resolved pattern per measurement point. Move the sensor to a second position to confirm the pattern is not a placement artefact. - ✔
Step 6 — Multi-condition verification: capture a second dataset under a different load condition or after a thermal soak. This catches the self-extinguishing PD pattern called out in section 2. - ✔
Step 7 — Reporting: PRPD screenshots, calibration record, noise survey snapshot, and explicit decision (no action / monitor / offline confirm / immediate intervention). A report without all four artefacts is incomplete and undefendable.
Team that use this workflow repeatedly return reports that are validated by third-party expert review. Teams that skip over steps 4 and 6 get challenged in asset owner reviews and re-tested. Expect approximately a 30-minute per asset saving for assembly and execution over an incomplete survey. Expect a re-test to consume a full mobilisation.
10. What’s Changing in Field PD Testing in 2026
Three trends are shifting field PD economics and capability in 2026 — each with a concrete decision implication for procurement and workflow planning.
Continuous online monitoring is growing faster than periodic surveys. The global PD monitoring systems market hit USD 562 million in 2025 with a projected CAGR above 5.2%, while online-specific monitoring is projected to grow from USD 540 million (2024) toward USD 798 million per Congruence Market Insights. Periodic surveys are not disappearing — they remain dominant by unit volume — but the fastest-growing budget category is multi-year continuous-monitoring contracts on critical assets. If you are planning a 2026–2028 capex cycle, model both periodic equipment purchase and continuous-monitoring service contracts; assuming “buy more meters” is the only option misses the shift.
AI-assisted pattern recognition is moving from research to product. Field engineers in 2026 are increasingly reviewing AI-flagged PRPD patterns rather than analysing every measurement from scratch. Implication for procurement is that the cloud platform behind the sensor matters as much as the sensor itself. Specify the analytics platform’s pattern library coverage and update cadence in the same RFP as the hardware.
IEC 60270 is now in its 2025 edition. Tender documents and acceptance test protocols written against IEC 60270:2000 should be reviewed and re-issued; the 2025 edition refines several measurement provisions, and writing future tenders against the previous edition opens disputes during acceptance. If you are planning equipment purchases or factory acceptance tests after Q3 2026, ensure your specifications cite IEC 60270:2025 explicitly. Field-ready high-voltage test equipment sourced today should ship with documentation that references the current edition.
FAQ — Field PD Testing
Q: What is PD testing of electrical equipment?
View Answer
Q: What is an offline PD test?
View Answer
Q: What is a PD test in a current transformer?
View Answer
Q: How accurate is field PD testing compared to laboratory testing?
View Answer
Q: What is the difference between PDIV and PDEV?
View Answer
PDIV is the partial discharge inception voltage – the voltage at which PD activity appears, with increasing voltage. PDEV is the partial discharge extinction voltage – the voltage at which activity stops, with decreasing voltage. The difference between PDEV and the rated operating voltage is the ‘design margin’.
The difference between PDIV and PDEV, is the ease with which the discharge reignites after being broken, and is a good secondary diagnostic.
Q: How often should PD testing be performed on field equipment?
View Answer
Related Articles
- How to Choose the Best Partial Discharge Test Equipment — selection criteria for procurement
- Partial Discharge Testing Fundamentals — physics and measurement principles
- Using a PD Tester for Preventive Maintenance — programme economics and case work
- Top Features in a Partial Discharge Analyzer — feature checklist for spec-writing
- Ultimate Guide to High Voltage Testers — broader test-equipment context
About This Field Guide
A synthesis of field PD testing practice from IEC 60270: 2025, IEC 62478, IEEE 400.3, IEEE C57.113, the CIGRE WG D1.37 technical brochure, and the most relevant recent peer-reviewed sensor-comparison studies. Five-failure-modes of PD and seven-element workflow are derived from these sources as well as published case work; specific operational thresholds will be asset- and environment-dependent, and subject to local standards. Reviewed by the DEMIKS Power engineering team.
References & Sources
- IEC 60270:2025 — High-voltage test techniques: Charge-based partial discharge measurement — International Electrotechnical Commission
- IEEE Field Guide for Partial Discharge Measurement on Liquid-filled Power Transformers — IEEE Transformers Committee, Dielectric Test Subcommittee
- Introduction to Partial Discharge: Causes, Effects, and Detection — IEEE Southern Alberta PES/IAS Chapter
- CIGRE WG D1.37 Technical Brochure — Guidelines for Partial Discharge Detection Using Conventional and Unconventional Methods — International Council on Large Electric Systems (CIGRE)
- Application of HFCT and UHF Sensors in On-Line Partial Discharge Measurements — PubMed Central (peer-reviewed research)
- Monitoring of Partial Discharges on Cable Terminations — KTH Royal Institute of Technology
- Partial Discharge Monitoring Systems Market — Size, Share & Growth Report — ResearchNester
- Partial Discharge: An Interview with the Experts — Megger Electrical Tester (industry publication)